Process 01
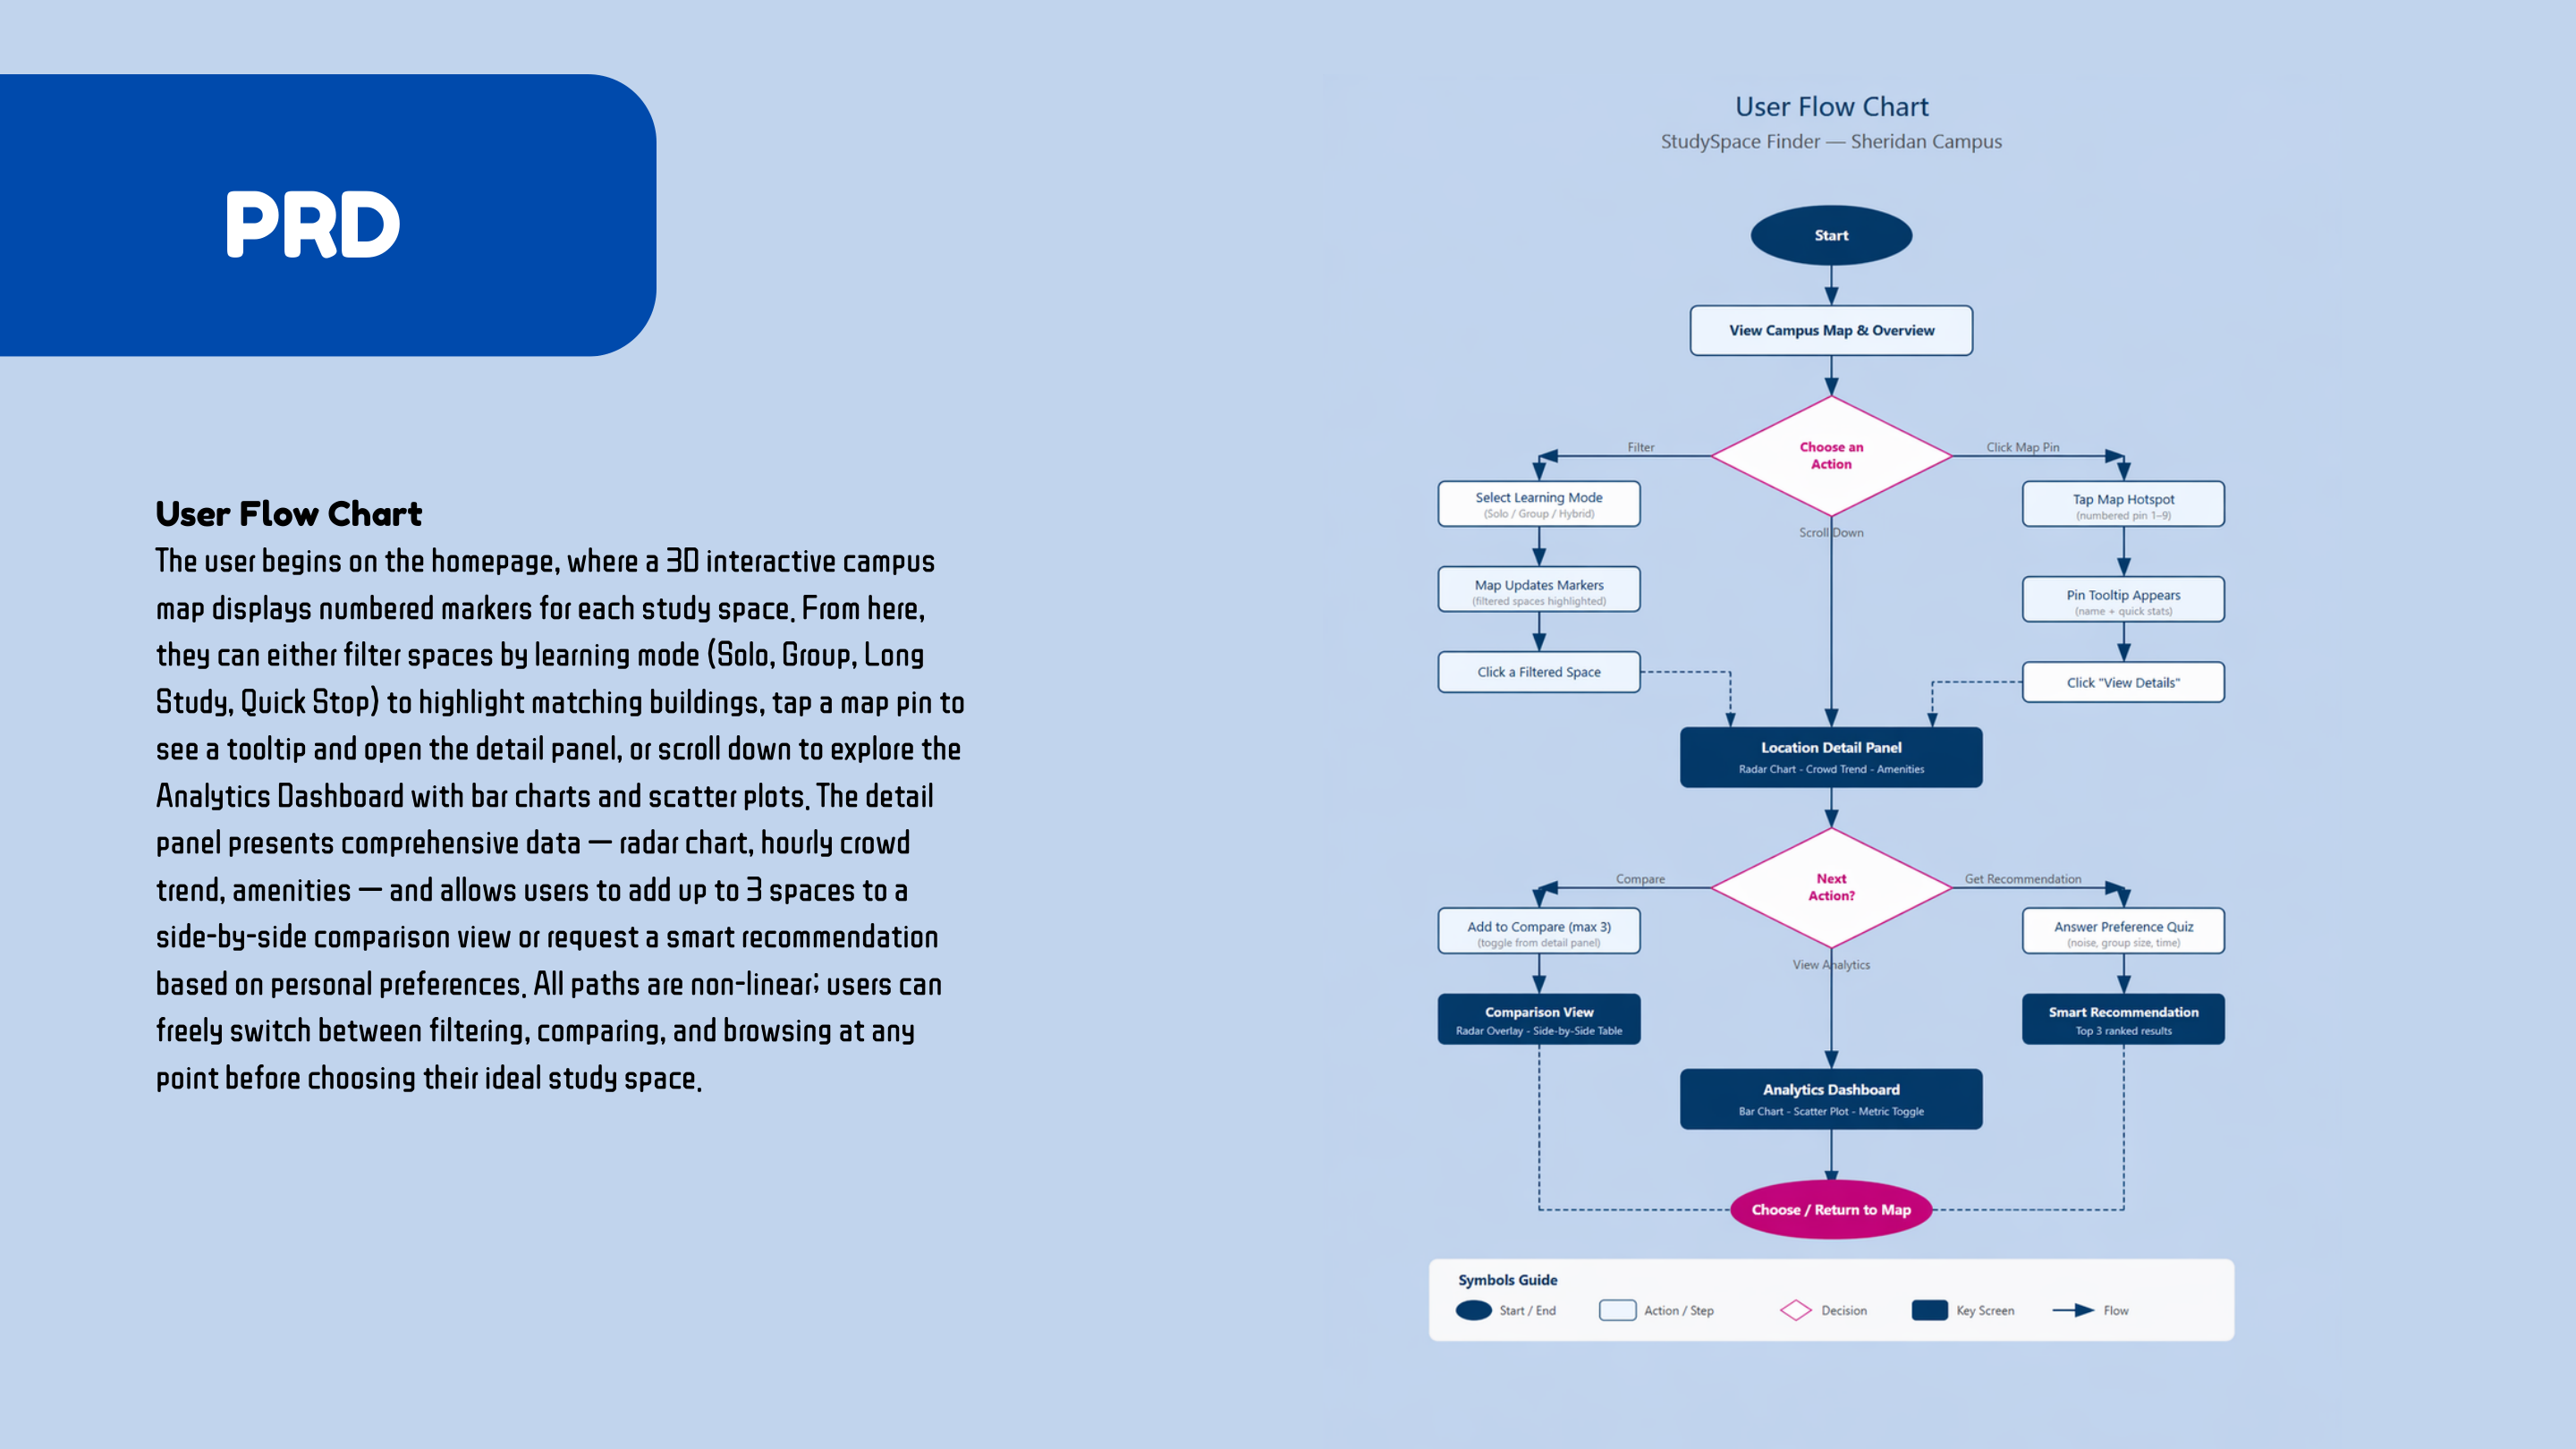
User flow logic
The flow is non-linear: users can filter, inspect a pin, compare spaces, review analytics, or return to the map at any point.
Data Visualization / Dashboard Design / Figma Make
An interactive data visualization product that helps Sheridan students compare campus study spaces by noise, comfort, crowd level, amenities, and learning mode.
Role
Dashboard UX Designer, Data Visualization Designer
Tools
Figma Make, React, Recharts, Tailwind CSS, AI-assisted iteration
Focus
Campus map, study-space filters, comparison and recommendation flow
Overview
Students often waste time moving between campus spaces because the information they need is scattered or invisible: how quiet a space is, how crowded it feels, whether outlets are available, and whether the room supports solo or group work.
This dashboard turns those questions into a visual decision tool. Users can start from a campus map, filter by study mode, inspect location details, compare spaces side by side, and review recommendation cards for different study needs.
Live Prototype Preview
Open in new tabProduct System
The interface is designed around a student decision loop: locate a space, understand the tradeoffs, compare options, and choose a place that fits the current task.
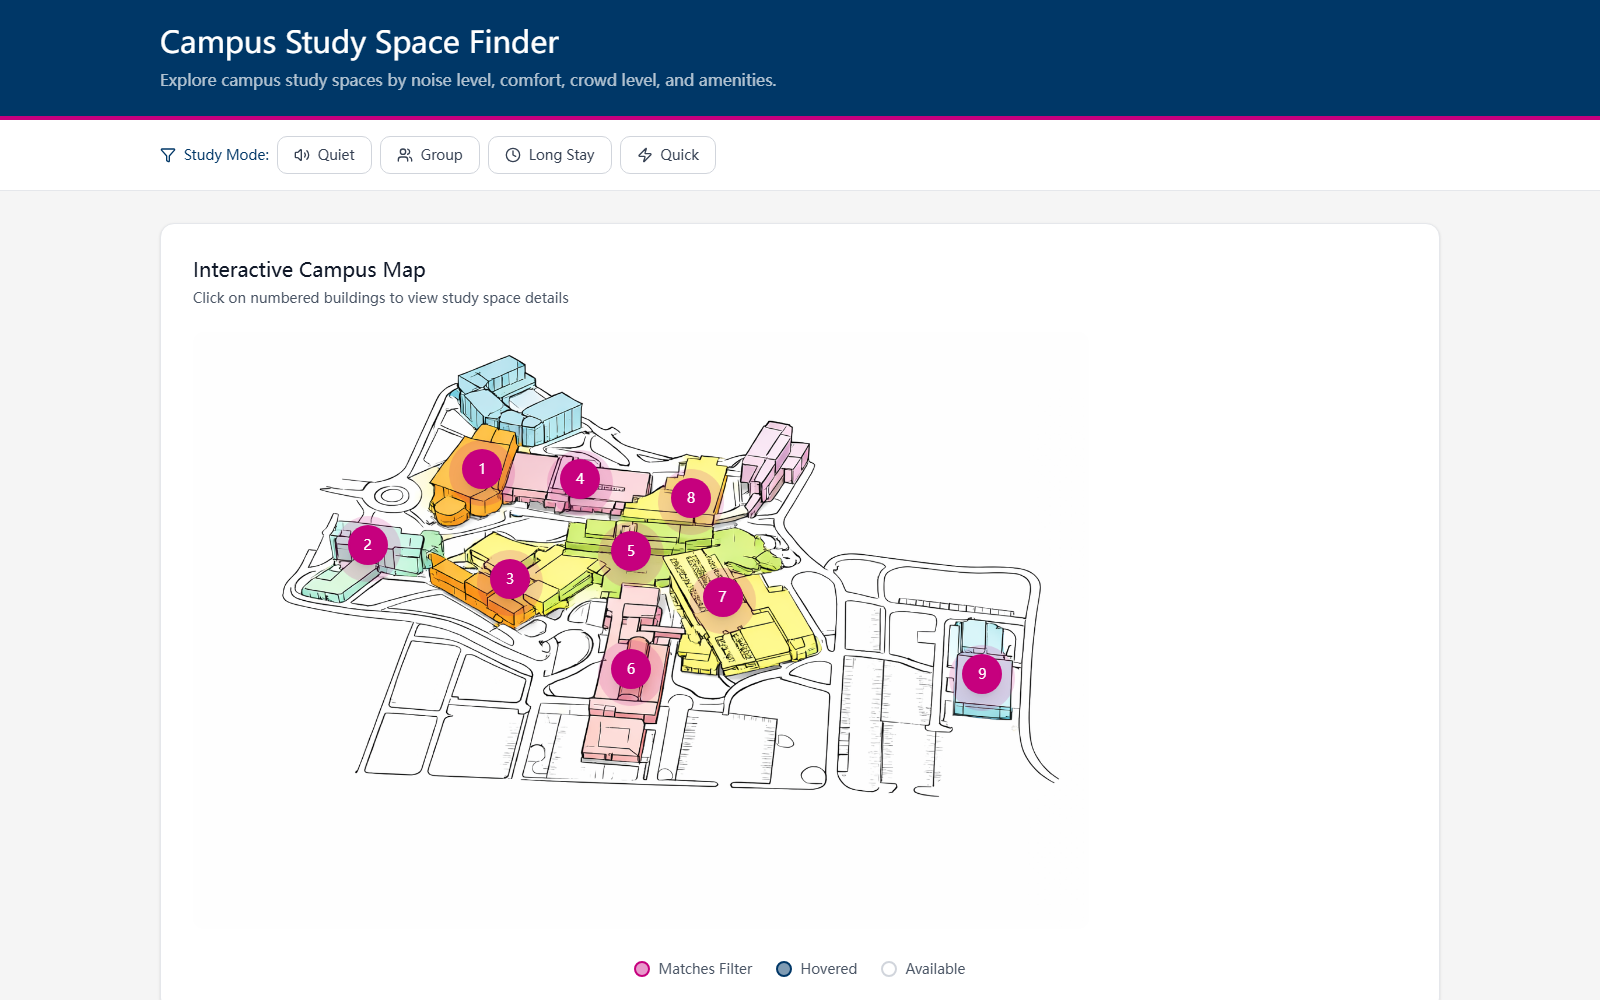
Map-first browsing
The main screen starts with a visual campus map so students can orient themselves before moving into detailed metrics.
Users can filter locations by Quiet, Group, Long Stay, or Quick Stop so the map immediately supports different study needs.
Numbered map markers make the campus easier to scan, while each location can open a detail panel with metrics and context.
Bar charts and scatter plots help students compare comfort, noise, crowd level, outlets, and satisfaction at a glance.
Personalized recommendation cards and side-by-side comparison help users move from browsing to choosing a space.
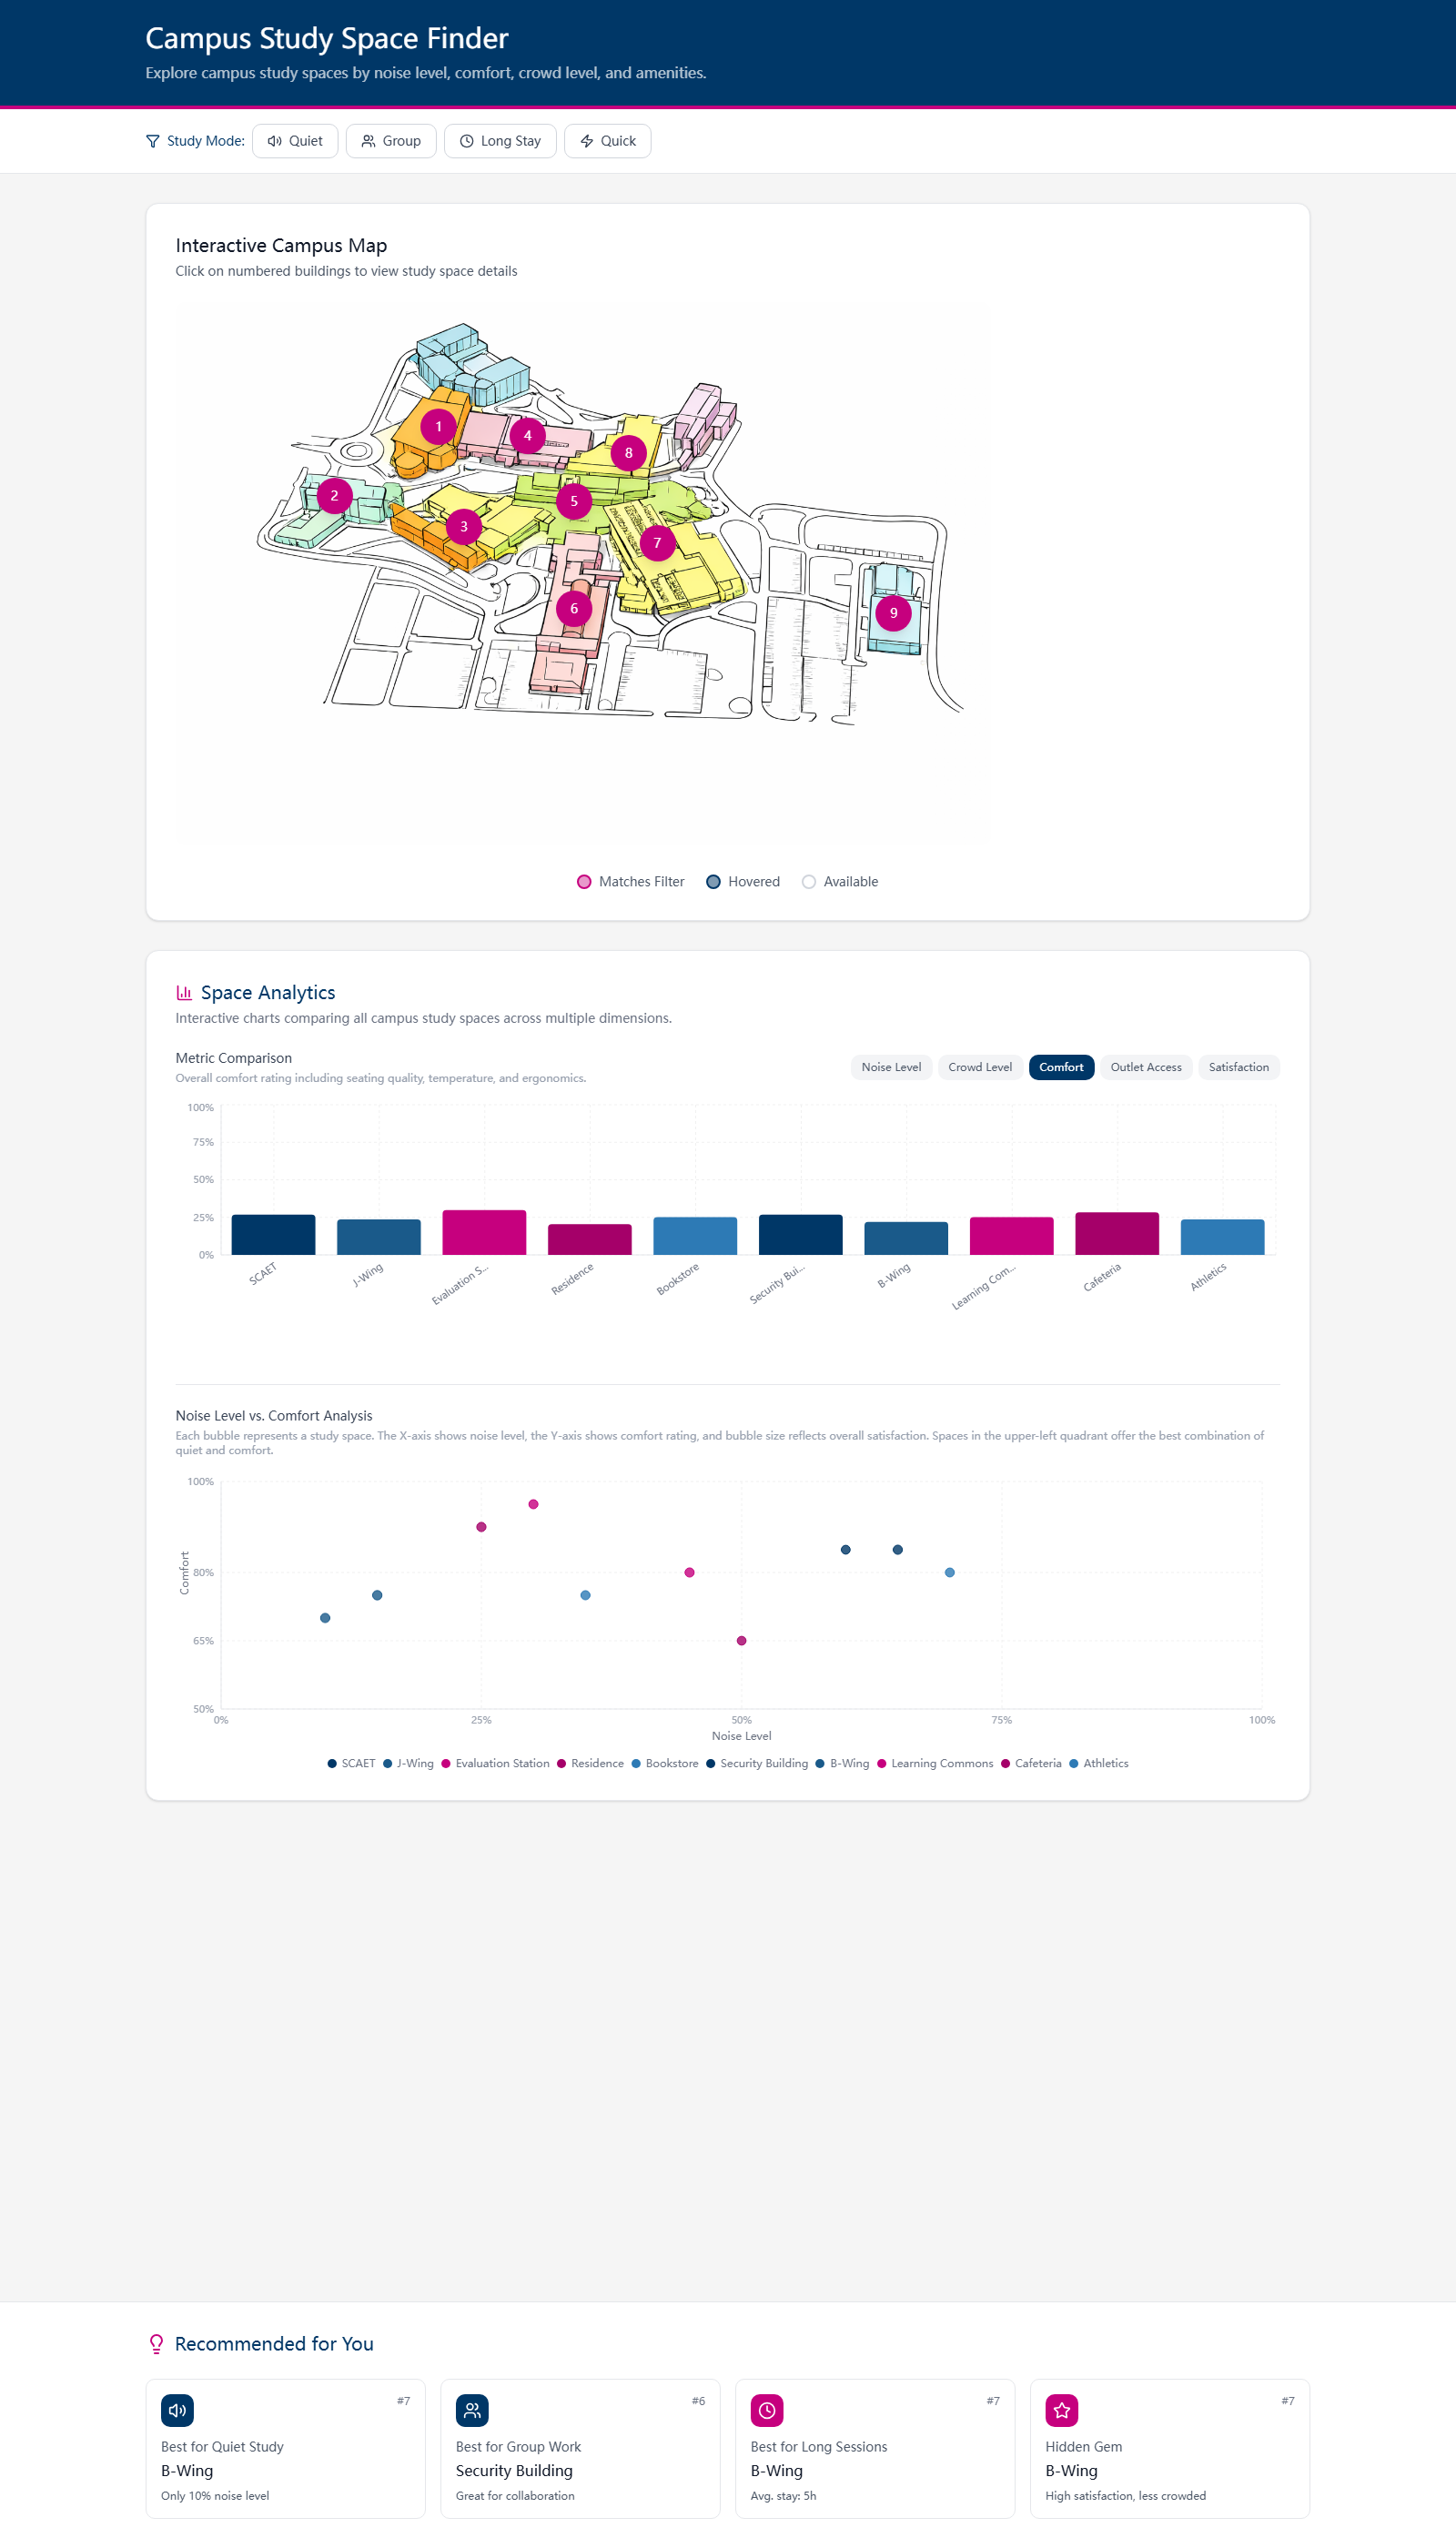
Analytics dashboard
Metric controls switch the bar chart focus, while the scatter plot helps compare spaces through noise level, comfort, and satisfaction.
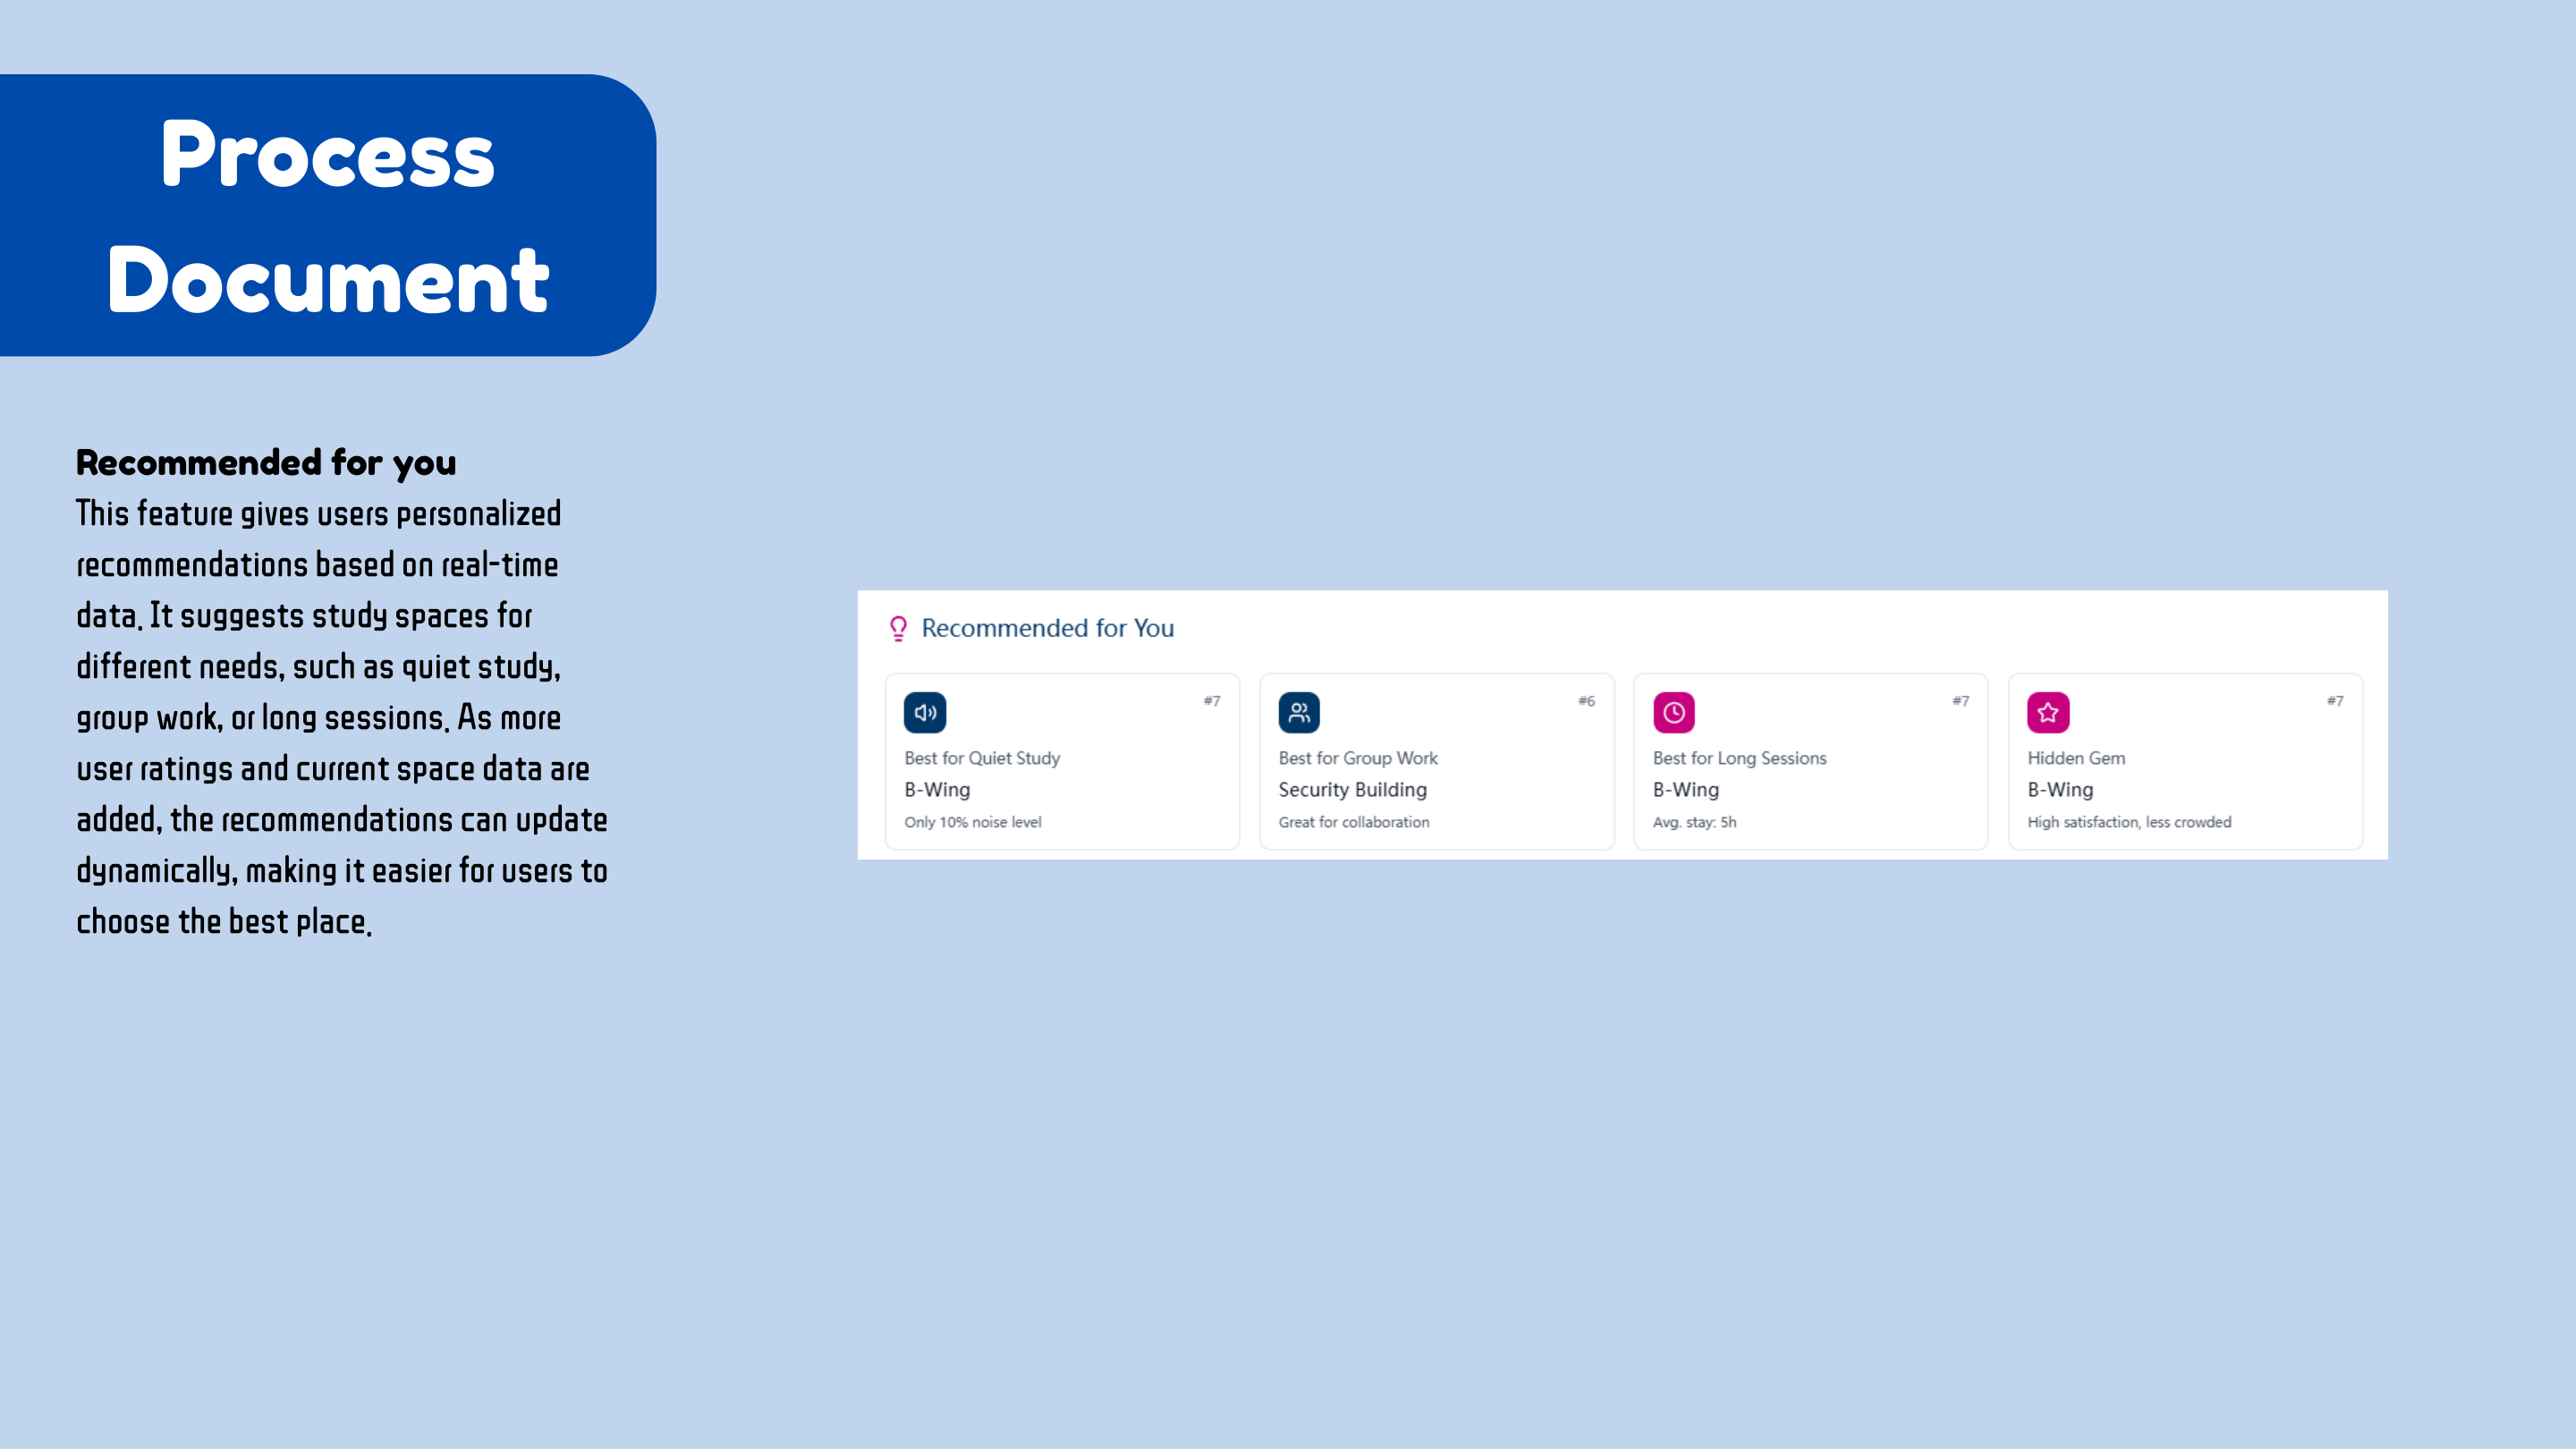
Recommendation cards
The recommendation layer translates raw metrics into easier choices like quiet study, group work, long sessions, and hidden gems.
Process
The process moved through problem framing, user flow mapping, map readability, chart selection, and AI-assisted front-end iteration. Each step made the dashboard easier to scan and easier to use.
I framed the dashboard around a practical campus issue: students often know they need a place to study, but they cannot quickly compare noise, comfort, crowding, outlets, and fit.
The user flow lets students start from the map, filter by study mode, inspect a location, compare up to three options, or ask for a recommendation.
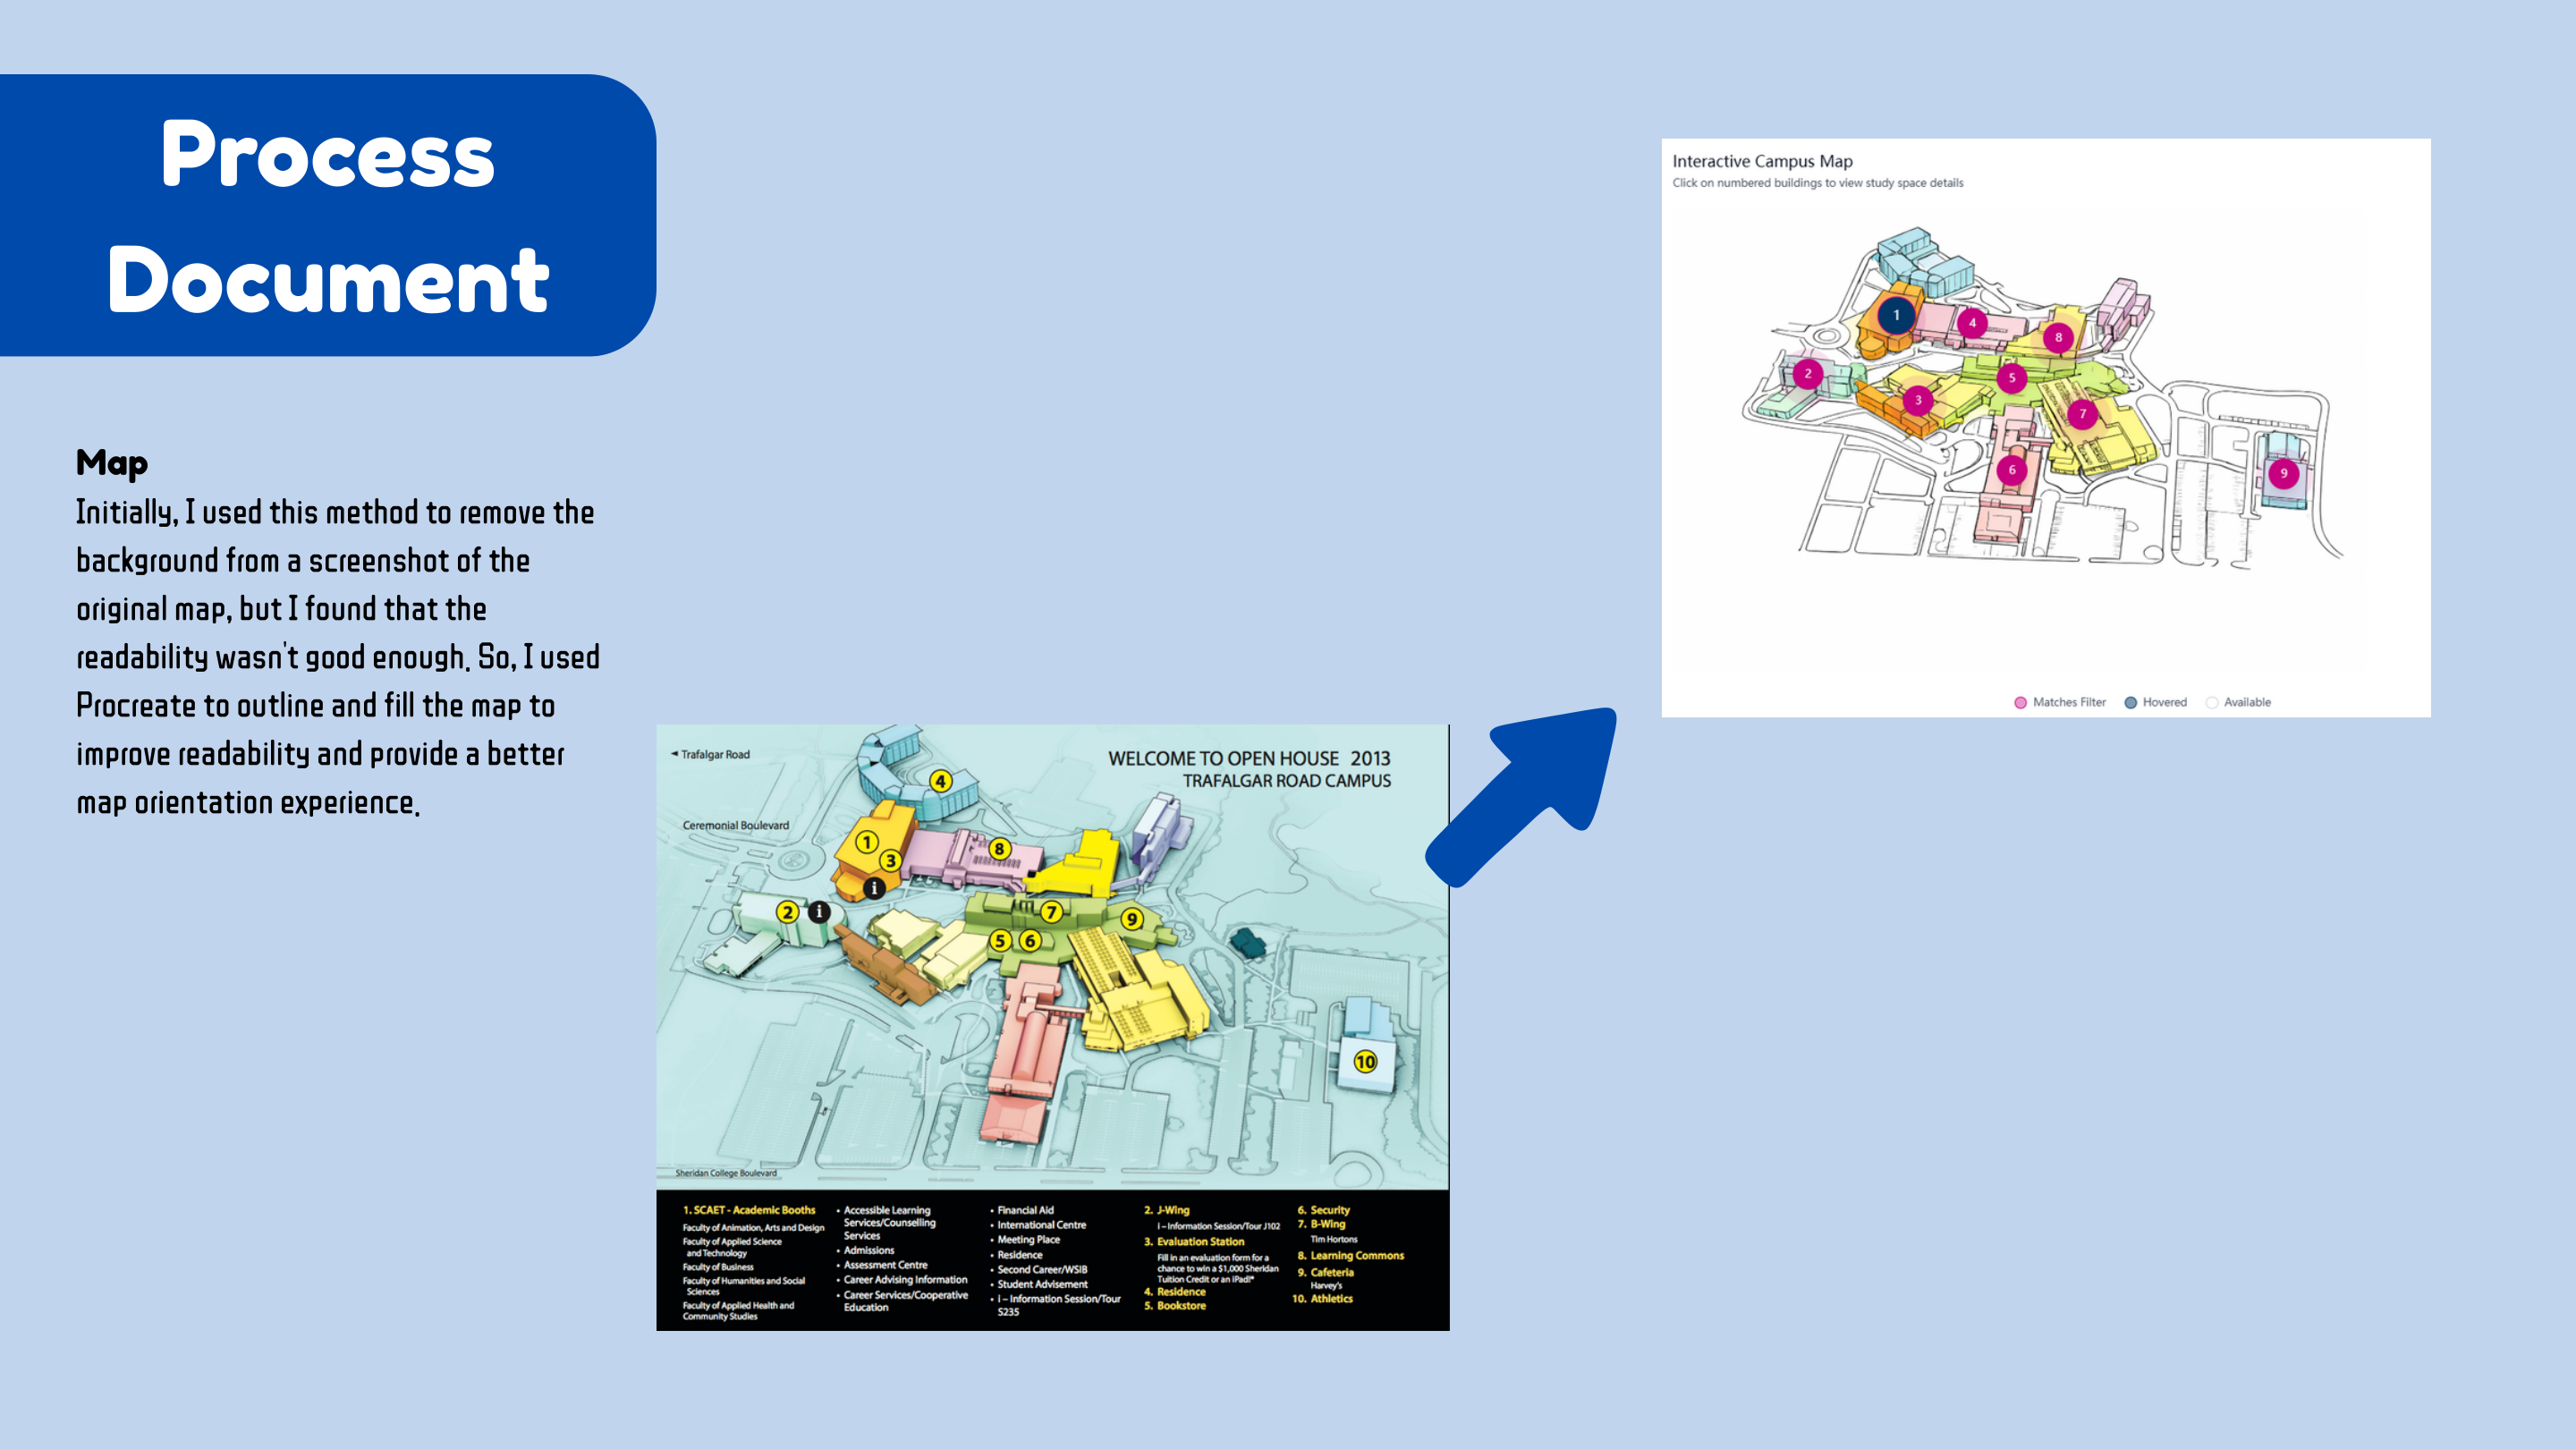
The campus map was redrawn and simplified so it could work as an interface, not just a reference image. Numbered pins make locations easier to identify.
The final prototype uses chart components, metric toggles, detail panels, and recommendation cards to keep the decision process visible.
Process 01
The flow is non-linear: users can filter, inspect a pin, compare spaces, review analytics, or return to the map at any point.
Process 02
The map was simplified from the original campus reference so the interface could support quick orientation and cleaner markers.
Process 03
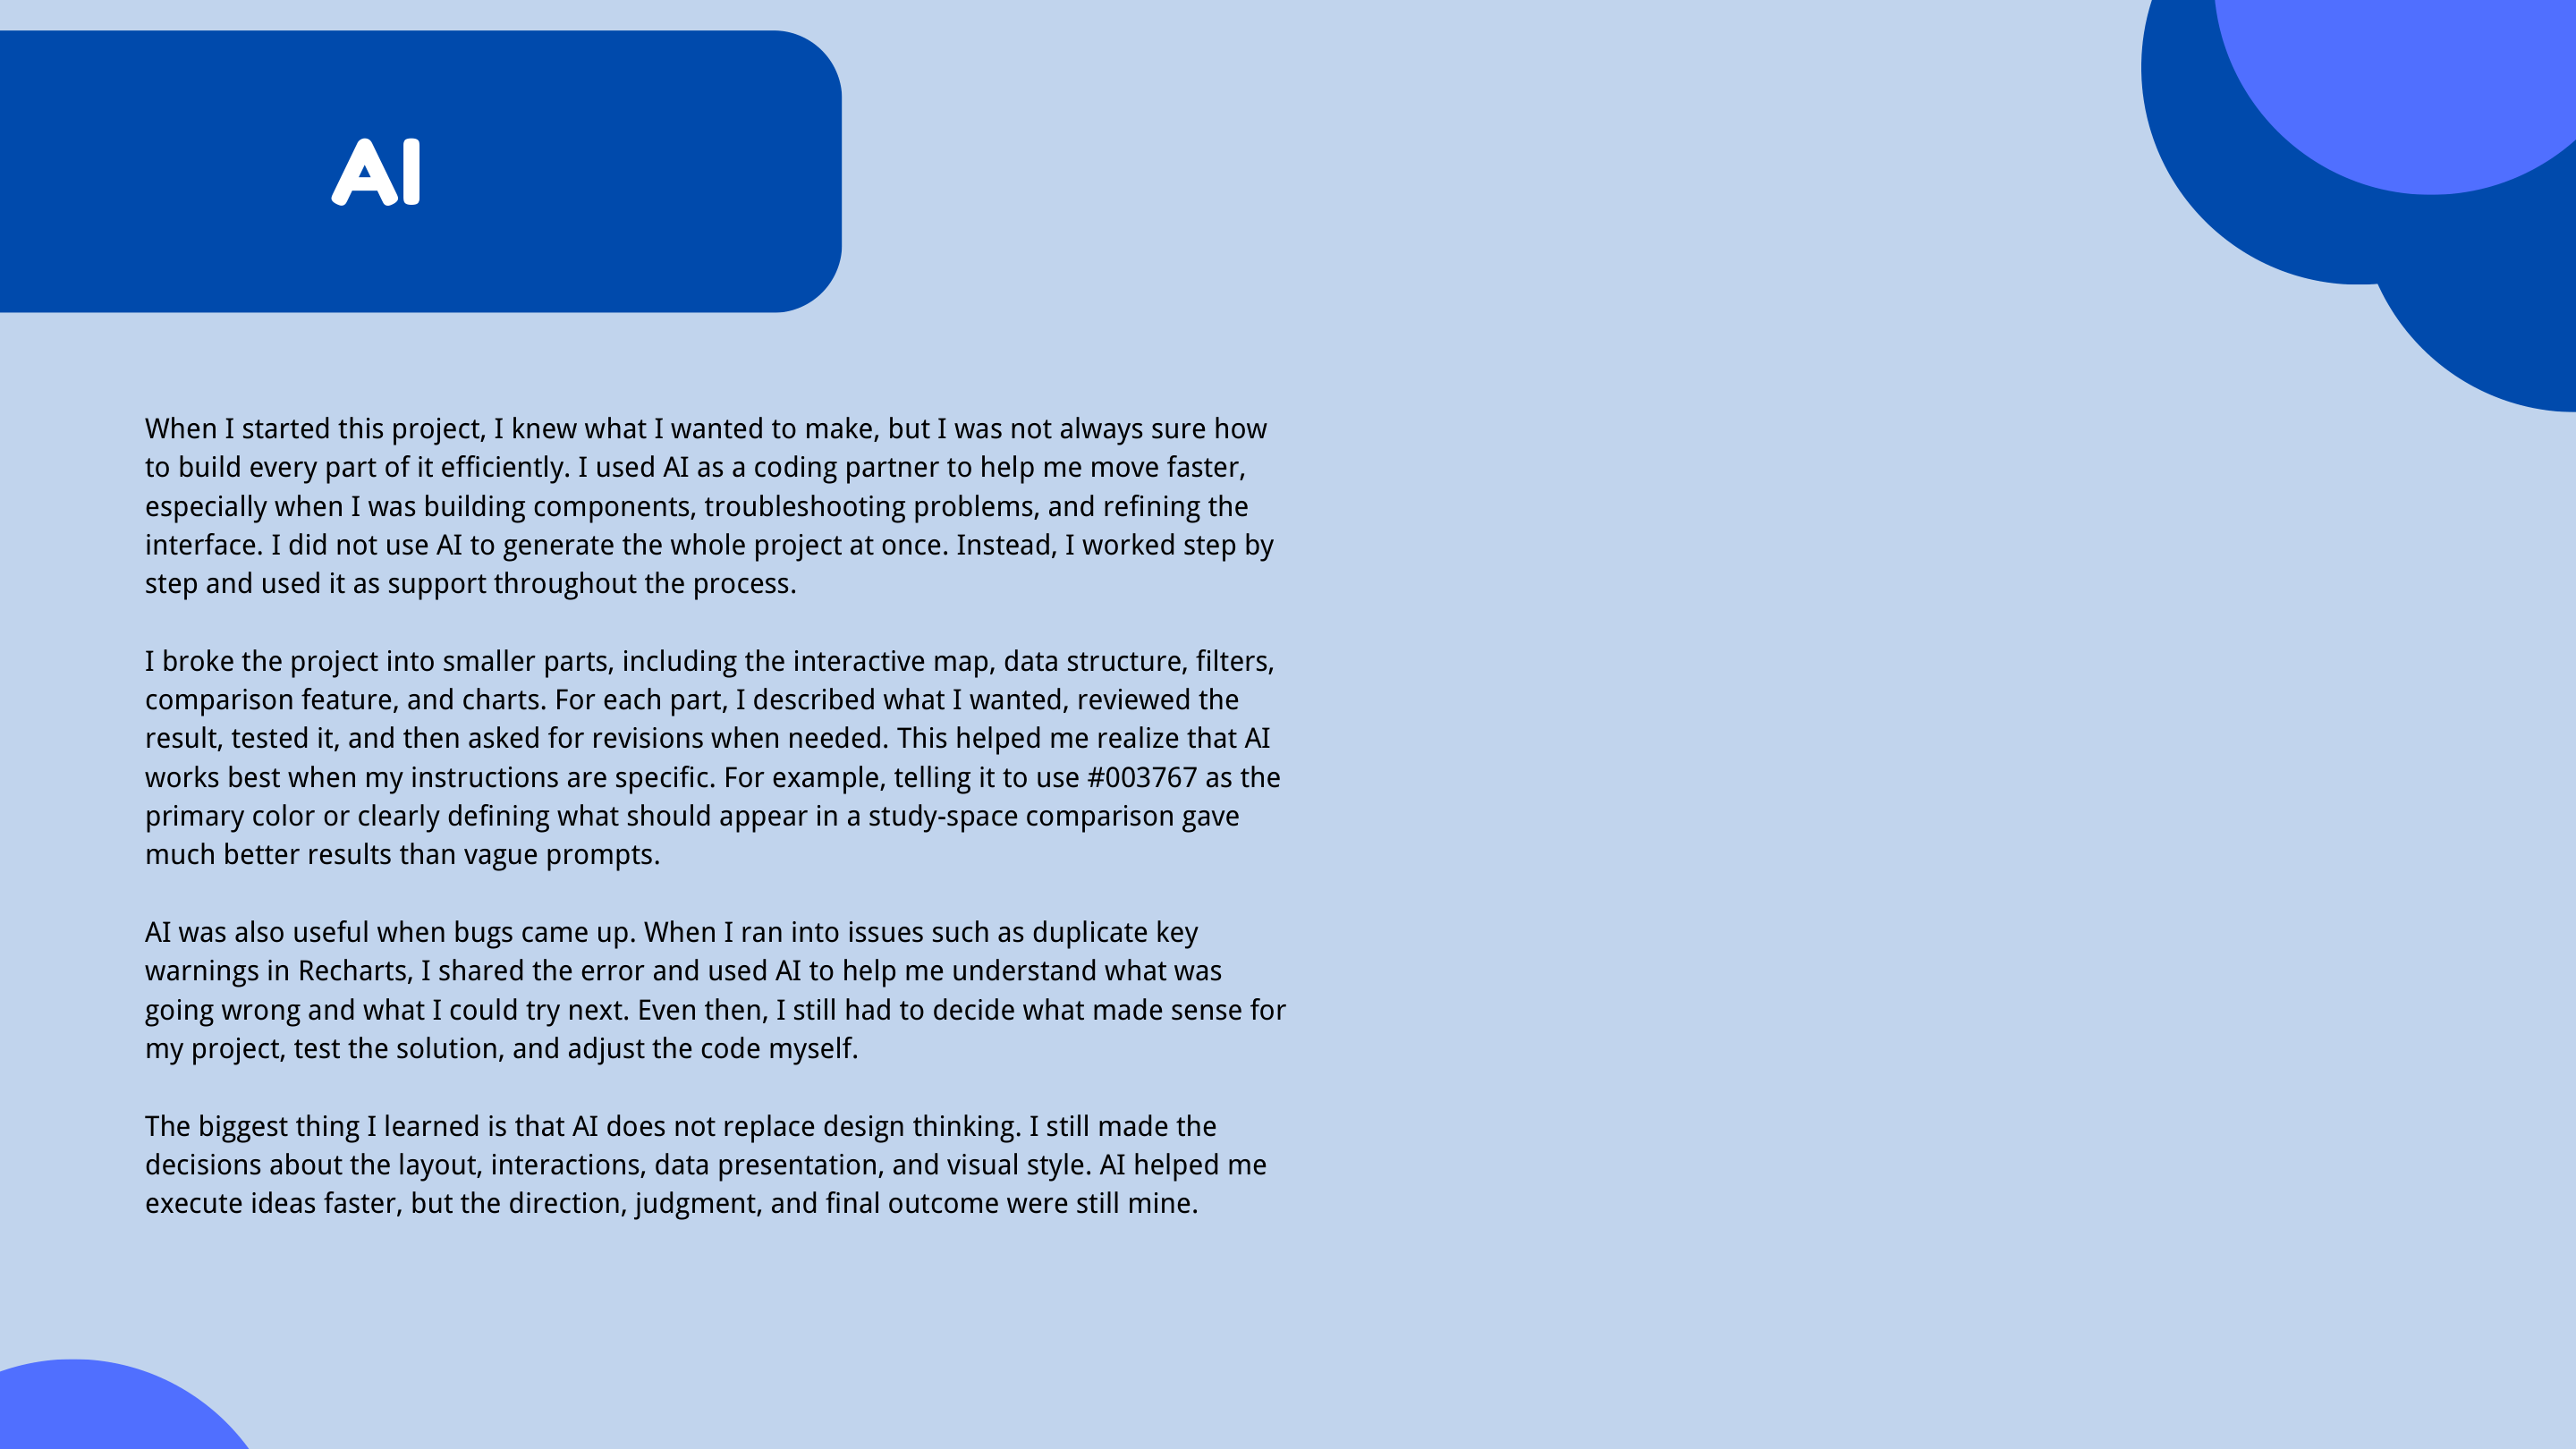
AI was used as a coding partner for component building, troubleshooting, and iteration while design judgment stayed with the designer.
Design Decisions
The chart system uses simple visual forms because the user goal is fast comparison, not data exploration for its own sake. Bar charts work for metric ranking, scatter plots show relationships, and radar charts support side-by-side space profiles.
The interface also avoids a single linear path. Students can browse visually, use filters, inspect details, compare, or jump to recommendations depending on how much they already know about the campus.
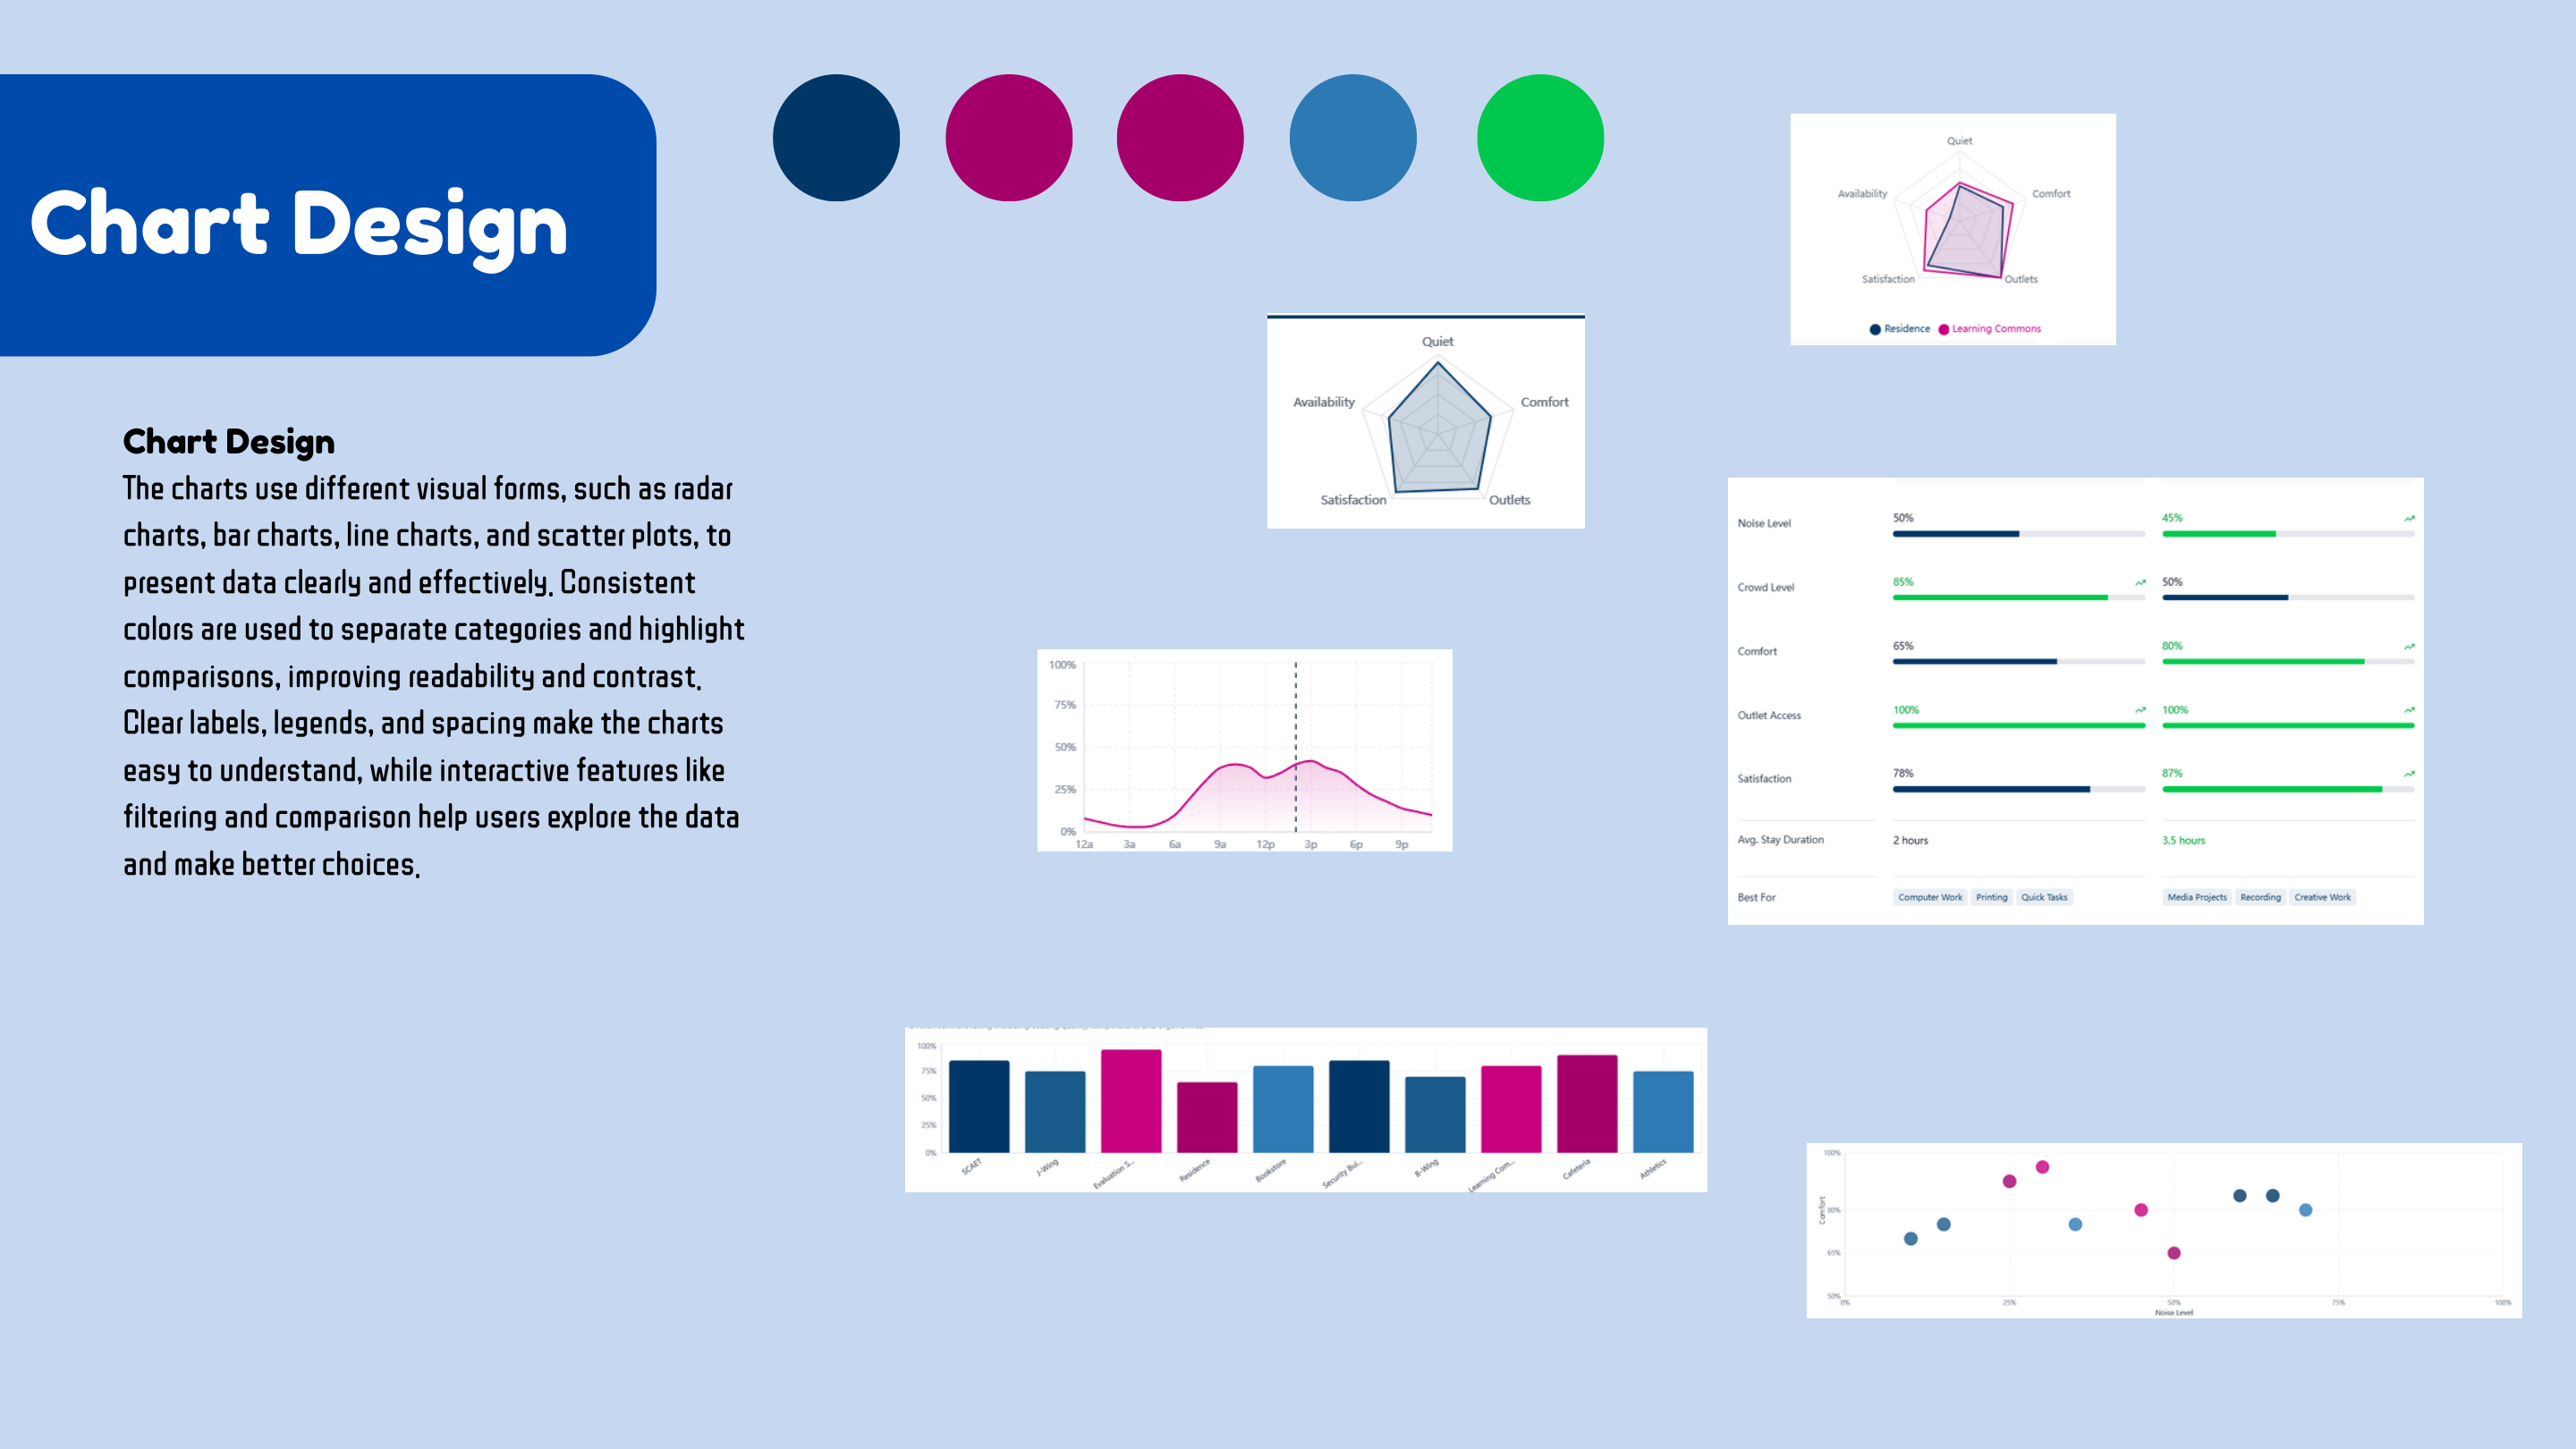
Chart choices were selected for readability, comparison, labels, spacing, and clear interaction states.
Skills Used
Result
The final prototype presents a complete decision system: filter the campus map, inspect study spaces, compare chart-based metrics, and receive recommendations that translate data into a clear next step.
Open live prototype